Google Analytics
What is Google Analytics?
Google Analytics is a web analytics service that provides numerous analytical tools useful for insights on website performance and marketing campaigns. Google Analytics is a web analytics service that provides statistics and basic analytical tools for search engine optimization and marketing purposes. The service is part of the Google Marketing Platform and is available for free to anyone with a Google account, regardless of whether they are working with enterprises or small businesses.
Google Analytics is used to track website performance and collect visitor insights. It can help organizations determine top sources of user traffic, gauge the success of their marketing activities and campaigns, track goal completions (such as purchases, or adding products to carts), discover patterns and trends in user engagement, and obtain other visitor information such as demographics. Small and medium-sized retail websites often use Google Analytics to obtain and analyze various customer behavior analytics, which yield insight that can be the basis to improve marketing campaigns, drive website traffic and better retain visitors.
Google Analytics (also known simply as Analytics) provides a range of analytics tools that enable companies to capture customer insights across devices and platforms. By understanding how customers interact with the company's sites and apps throughout their lifecycle, the company's Google Analytics users can better understand the customer journey, identify opportunities for improving customer experiences and improve marketing ROI.
Google Analytics is easy to use. Besides powerful analytics capabilities, it includes built-in automation, provides a broad range of reporting options and can be integrated with other tools to become a single-measurement source of truth for customer data and insights. It also supports custom data analyses to fit the needs of different businesses. A business is on the path to a competitive advantage if it can analyze the broad span of customer journey touchpoints.
How does Google Analytics work?
To use Google Analytics, users must first create an Analytics account. This is different from a Google (Gmail) account. Having the latter does not automatically provide access to the former. A separate, one-time registration process is required.
For Google Analytics to work on the business user's website (meaning, to capture and display useful analytics), the user must add a small piece of JavaScript measurement code to each page on their site. This tracking code will collect pseudonymous information such as the following:
- How a site visitor interacted with the page.
- Which browser the visitor used.
- The browser's language setting.
- Which device and operating system the browser is running on.
- Which traffic source (search engine, online ad, email marketing campaign, etc.) brought the user to the site.
Google Analytics will not collect data for any page lacking the tracking code. All collected data is aggregated and stored in a database. It is also organized and processed. Google Analytics creates reports that can help users better understand their customers and marketing results. Once processed data is stored in a database, it cannot be modified, so it's important for users to be careful about excluding data. These exclusions usually happen when users (mistakenly) assume they won't need some types of data for analysis and, on that basis, add filters to exclude it from analysis in Google Analytics.
Google Analytics acquires user data from each website visitor through page tags. A JavaScript page tag, inserted into the code of each page, helps generate data such as the number of users, bounce rates, average session duration, sessions by channel, pageviews, goal completions and more.
The page tag functions as a web bug or web beacon to gather visitor information. Because it relies on cookies, the system can't collect data for users who have disabled them.
Google Analytics features
Google Analytics includes numerous features that help users do more with customer data:
- Built-in automation to surface actionable insights, predict future actions, create a complete picture of customer journeys, and uncover useful metrics, reports and insights.
- Privacy-safe, machine learning-based models to enhance understanding of customer behaviors and conversions based on observed, first-party and consented data.
- Funnel exploration to visualize how site or app users complete tasks and if they're part of over-performing or under-performing audiences.
- Data collection and management tools, including collection application programming interfaces (APIs) and admin APIs.
- Segment overlap to set new criteria and identify new customer segments that fit those criteria.
- Advertising workspace to assess multichannel media spends and create advertising budgets.
Reporting in Google Analytics
Google Analytics provides many types of reports, including the following:
- Real-time reports to monitor site or app activity as it happens.
- Engagement reports to identify engagement and conversion-driving content (on the site or app).
- Monetization reports to uncover the revenue the site or app generates.
- Acquisition reports to understand how the business acquires users and traffic.
Depending on their specific analysis or decision-making requirements, businesses can also use Google Analytics with Analytics 360 to get continuous intraday data, create separate data views for different countries or product lines, and see global metrics. In the Google Analytics dashboard, users can save profiles for multiple websites and see details for default categories or select custom metrics to display for each site. Available categories for tracking include content overview, keywords, referring sites, visitors overview, map overlay and traffic sources overview.
The dashboard can be viewed on the Google Analytics site and is available through a widget or a plugin for embedding into other sites. Customized Google Analytics dashboards are also available from independent vendors.
Important Google Analytics metrics
A metric is a standard of quantitative measurement. Google Analytics supports up to 200 different metrics to measure how websites are performing. Here are some of the most popular metrics:
- Users. A unique or new visitor to the website.
- Bounce rate. The percentage of visitors who viewed only a single page. These visitors only triggered a single request to the Google Analytics server.
- Sessions. The group of visitor interactions that happen in a 30-minute window of activity.
- Average session duration. How long on average each visitor stays on the site.
- Percentage of new sessions. The percentage of website visits that are first-time visits.
- Pages per session. The average number of pageviews per each session.
- Goal completions. The number of times visitors complete a specified, desirable action, called a conversion.
- Pageviews. Total number of pages viewed.
Metrics vs. dimensions
Google Analytics reports consist of dimensions and metrics. Understanding the difference between them is critical for proper interpretation of reports.
Dimensions. These are qualitative attributes or labels used to describe and organize data. If the average session length is measured across several different regions, the dimensions would be "Region." "Average session length," which is a quantitative measurement, is an example of a metric.
Dimensions can be customized in Google Analytics. Examples of common dimensions include the following:
- Language.
- Browser type.
- City and country.
- Models of devices.
- User age group.
Metrics. These are quantitative measurements of a single type of data. Examples of metrics include average session lengths, pageviews, pages per session and average time on site. Metrics are used to compare measurements across different dimensions.
Benefits and limitations
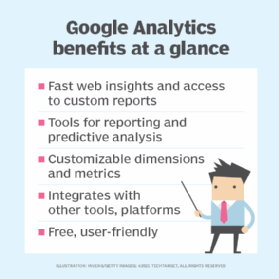
Here are the main benefits of Google Analytics:
- It is free and easy to use.
- It provides multiple tools to capture (and ultimately act on) customer insights.
- It integrates with many Google and third-party tools to provide a more comprehensive view of customers across a business's sites or apps.
- It uses Google's machine learning to generate new and predictive insights that may set a foundation for improvements in marketing and business ROI.
- Easy-to-use interface and shareable reports facilitate information sharing. Built-in technical support and Google's global infrastructure make the system reliable and can help users maintain control of their data.
One of the limitations of Google Analytics is its reliance on data sampling techniques. In addition, data quality can be compromised by users who block Google Analytics cookies, certain browser extensions, ad filtering programs and privacy networks. The General Data Protection Regulation (GDPR), among other recent rules, has expanded the privacy rights of users.
User acquisition data vs. user behavior data
Google Analytics can provide businesses with multiple types of data for marketing purposes.
User acquisition data provides insight into how customers are arriving at a website. Customers may come from a variety of channels, such as paid search engine results, unpaid (organic) search engine results, social media links or directly typing in the URL. Understanding user acquisition data is critical for maximizing website traffic.
User behavior data shows what customers are doing on the website and how they are engaging with the site. This includes how long they spend on each page, how many pages they visit, and if they engage with videos and graphics. This data can facilitate discussion of new or revised web layouts that better connect visitors with the content they are looking for, leading to a better user experience. User experiences optimized according to user behavior data are more likely to create sales and conversions.
Google Analytics 4
Google Analytics 4 (GA4) is the most recent version of the service, released in October 2020. Unlike the previous version (known as Universal Analytics or UA), GA4 uses an event-based data model, meaning it tracks each user interaction as an individual event. It also facilitates holistic data collection across multiple devices and platforms.
GA4 shifts from reliance on third-party cookies toward the use of machine learning for better data accuracy. GA4 uses machine learning to generate predictive insights from data. Its AI capabilities also enable behavioral and conversion modeling. Other key features in Google Analytics 4 include the following:
- Deeper integration with Google Ads.
- Customer-centric measurement and measurements across the entire customer lifecycle.
- Data controls to simplify data collection, retention and use.
- Stronger data privacy (because the default IP anonymization feature in GA4 means Google will not store users' IP addresses).
Google Analytics integrations
Google Analytics works with other Google solutions and partner products to help users improve marketing processes and performance. For example, Google Analytics can be connected to Google Ads so data from Google Ads will also be visible in Google Analytics (along with website and app performance data). Similarly, data from Display & Video 360 can be viewed in Google Analytics to help with automated bidding and create new audiences, as can data from the Google Search Console. The latter connection is helpful to identify the search queries driving users to a website and to assess the relationship between organic search performance and on-site action.
Google Analytics data can seamlessly connect with other data sets to support business analysis and decision-making. It also comes with a built-in connection to BigQuery, Google Cloud's enterprise data warehouse, for seamless insight generation and data analysis.
Google Analytics also integrates with third-party tools like Salesforce Marketing Cloud (SFMC). Users can view Google Analytics data in the SFMC reporting UI to better understand campaign performance (e.g., email marketing campaigns) and identify improvement areas for future campaigns.
Customer data and behavior analytics from tools like Google Analytics can give content managers insight into the kind of content site visitors want. Explore ways analytics can improve organizations' content strategies.