big data analytics
What is big data analytics?
Big data analytics is the often complex process of examining big data to uncover information -- such as hidden patterns, correlations, market trends and customer preferences -- that can help organizations make informed business decisions.
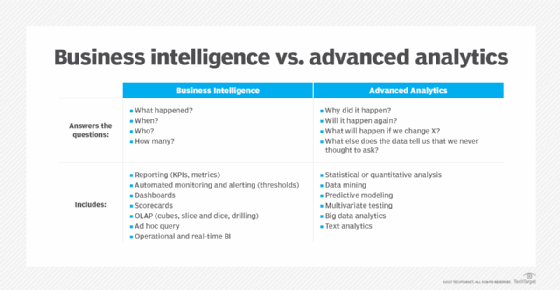
On a broad scale, data analytics technologies and techniques give organizations a way to analyze data sets and gather new information. Business intelligence (BI) queries answer basic questions about business operations and performance.
Big data analytics is a form of advanced analytics, which involve complex applications with elements such as predictive models, statistical algorithms and what-if analysis powered by analytics systems.
An example of big data analytics can be found in the healthcare industry, where millions of patient records, medical claims, clinical results, care management records and other data must be collected, aggregated, processed and analyzed. Big data analytics is used for accounting, decision-making, predictive analytics and many other purposes. This data varies greatly in type, quality and accessibility, presenting significant challenges but also offering tremendous benefits.
Why is big data analytics important?
Organizations can use big data analytics systems and software to make data-driven decisions that can improve their business-related outcomes. The benefits can include more effective marketing, new revenue opportunities, customer personalization and improved operational efficiency. With an effective strategy, these benefits can provide competitive advantages over competitors.
How does big data analytics work?
Data analysts, data scientists, predictive modelers, statisticians and other analytics professionals collect, process, clean and analyze growing volumes of structured transaction data, as well as other forms of data not used by conventional BI and analytics programs.
The following is an overview of the four steps of the big data analytics process:
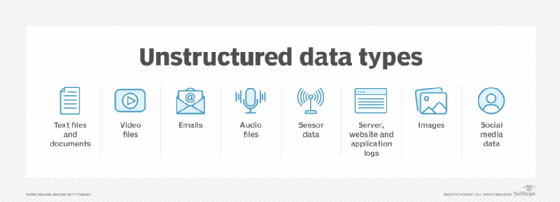
- Data professionals collect data from a variety of different sources. Often, it's a mix of semistructured and unstructured data. While each organization uses different data streams, some common sources include the following:
-
- Internet clickstream data.
- Web server logs.
- Cloud applications.
- Mobile applications.
- Social media content.
- Text from customer emails and survey responses.
- Mobile phone records.
- Machine data captured by sensors connected to the internet of things.
- Data is prepared and processed. After data is collected and stored in a data warehouse or data lake, data professionals must organize, configure and partition the data properly for analytical queries. Thorough data preparation and processing results in higher performance from analytical queries. Sometimes this processing is batch processing, with large data sets analyzed over time after being received; other times it takes the form of stream processing, where small data sets are analyzed in near real time, which can increase the speed of analysis.
- Data is cleansed to improve its quality. Data professionals scrub the data using scripting tools or data quality software. They look for any errors or inconsistencies, such as duplications or formatting mistakes, and organize and tidy the data.
- The collected, processed and cleaned data is analyzed using analytics software. This includes tools for the following:
-
- Data mining, which sifts through data sets in search of patterns and relationships.
- Predictive analytics, which builds models to forecast customer behavior and other future actions, scenarios and trends.
- Machine learning, which taps various algorithms to analyze large data sets.
- Deep learning, which is a more advanced offshoot of machine learning.
- Text mining and statistical analysis software.
- Artificial intelligence.
- Mainstream BI software.
- Data visualization tools.
Types of big data analytics
There are several different types of big data analytics, each with their own application within the enterprise.
- Descriptive analytics. This is the simplest form of analytics, where data is analyzed for general assessment and summarization. For example, in sales reporting, an organization can analyze the efficiency of marketing from such data.
- Diagnostic analytics. This refers to analytics that determine why a problem occurred. For example, this could include gathering and studying competitor pricing data to determine when a product's sales fell off because the competitor undercut it with a price drop.
- Predictive analytics. This refers to analysis that predicts what comes next. For example, this could include monitoring the performance of machines in a factory and comparing that data to historical data to determine when a machine is likely to break down or require maintenance or replacement.
- Prescriptive analytics. This form of analysis follows diagnostics and predictions. After an issue has been identified, it provides a recommendation of what can be done about it. For example, this could include addressing inconsistencies in supply chain that are causing pricing problems by identifying suppliers whose performance is unreliable, suggesting their replacement.
Key big data analytics technologies and tools
Many different types of tools and technologies are used to support big data analytics processes, including the following:
- Hadoop is an open source framework for storing and processing big data sets. Hadoop can handle large amounts of structured and unstructured data.
- Predictive analytics hardware and software process large amounts of complex data and use machine learning and statistical algorithms to make predictions about future event outcomes. Organizations use predictive analytics tools for fraud detection, marketing, risk assessment and operations.
- Stream analytics tools are used to filter, aggregate and analyze big data that might be stored in different formats or platforms.
- Distributed storage data is replicated, generally on a nonrelational database. This can be as a measure against independent node failures, lost or corrupted big data or to provide low-latency access.
- NoSQL databases are nonrelational data management systems that are useful when working with large sets of distributed data. NoSQL databases don't require a fixed schema, which makes them ideal for raw and unstructured data.
- A data lake is a large storage repository that holds native-format raw data until it's needed. Data lakes use a flat architecture.
- A data warehouse is a repository that stores large amounts of data collected by different sources. Data warehouses typically store data using predefined schemas.
- Knowledge discovery and big data mining tools help businesses mine large amounts of structured and unstructured big data.
- In-memory data fabric distributes large amounts of data across system memory resources. This helps provide low latency for data access and processing.
- Data virtualization enables data access without technical restrictions.
- Data integration software enables big data to be streamlined across different platforms, including Apache, Hadoop, MongoDB and Amazon EMR.
- Data quality software cleanses and enriches large data sets.
- Data preprocessing software prepares data for further analysis. Data is formatted and unstructured data is cleansed.
- Apache Spark is an open source cluster computing framework used for batch and stream data processing.
- Microsoft Power BI and Tableau end-to-end analytics platforms bring big data analytics to the desktop and back out to dashboards, with full suites of tools for analysis and reporting.
Big data analytics applications often include data from both internal systems and external sources, such as weather data or demographic data on consumers compiled by third-party information services providers. In addition, streaming analytics applications are becoming more common in big data environments as users look to perform real-time analytics on data fed into Hadoop systems through stream processing engines, such as Spark, Flink and Storm.
Early big data systems were mostly deployed on premises, particularly in large organizations that collected, organized and analyzed massive amounts of data. But cloud platform vendors, such as Amazon Web Services (AWS), Google and Microsoft, have made it easier to set up and manage Hadoop clusters in the cloud. The same goes for Hadoop suppliers such as Cloudera, which support the distribution of the big data framework on AWS, Google and Microsoft Azure clouds. Users can spin up clusters in the cloud, run them for as long as they need and then take them offline with usage-based pricing that doesn't require ongoing software licenses.
Big data has become increasingly beneficial in supply chain analytics. Big supply chain analytics uses big data and quantitative methods to enhance decision-making processes across the supply chain. Specifically, big supply chain analytics expands data sets for increased analysis that goes beyond the traditional internal data found on enterprise resource planning and supply chain management systems. Also, big supply chain analytics implements highly effective statistical methods on new and existing data sources.
Big data analytics uses and examples
The following are some examples of how big data analytics can be used to help organizations:
- Customer acquisition and retention. Consumer data can help the marketing efforts of companies, which can act on trends to increase customer satisfaction. For example, personalization engines for Amazon, Netflix and Spotify can provide improved customer experiences and create customer loyalty.
- Targeted ads. Personalization data from sources such as past purchases, interaction patterns and product page viewing histories can help generate compelling targeted ad campaigns for users on the individual level and on a larger scale.
- Product development. Big data analytics can provide insights to inform organizations about product viability, development decisions, progress measurement and steer improvements in the direction of what best fits customer needs.
- Price optimization. Retailers can opt for pricing models that use and model data from a variety of data sources to maximize revenues.
- Supply chain and channel analytics. Predictive analytical models can help with preemptive replenishment, business-to-business supplier networks, inventory management, route optimizations and the notification of potential delays to deliveries.
- Risk management. Big data analytics can identify new risks from data patterns for effective risk management strategies.
- Improved decision-making. Insights business users extract from relevant data can help organizations make quicker and better decisions.
Big data analytics benefits
The benefits of using big data analytics include the following:
- Real-time intelligence. Organizations can quickly analyze large amounts of real-time data from different sources, in many different formats and types.
- Better-informed decisions. Effective strategizing can benefit and improve the supply chain, operations and other areas of strategic decision-making.
- Cost savings. This can result from new business process efficiencies and optimizations.
- Better customer engagement. A better understanding of customer needs, behavior and sentiment can lead to better marketing insights and provide information for product development.
- Optimize risk management strategies. Big data analytics improve risk management strategies by enabling organizations to address threats in real time.
Big data analytics challenges
Despite the wide-reaching benefits that come with using big data analytics, its use also comes with the following challenges:
- Data accessibility. With larger amounts of data, storage and processing become more complicated. Big data should be stored and maintained properly to ensure it can be used by less experienced data scientists and analysts.
- Data quality maintenance. With high volumes of data coming in from a variety of sources and in different formats, data quality management for big data requires significant time, effort and resources to properly maintain it.
- Data security. The complexity of big data systems presents unique security challenges. Properly addressing security concerns within such a complicated big data ecosystem can be a complex undertaking.
- Choosing the right tools. Selecting from the vast array of big data analytics tools and platforms available on the market can be confusing, so organizations must know how to pick the best tool that aligns with users' needs and infrastructure.
- Talent shortages. With a potential lack of internal analytics skills and the high cost of hiring experienced data scientists and engineers, some organizations are finding it hard to fill the gaps.
History and growth of big data analytics
The term big data was first used to refer to increasing data volumes in the mid-1990s. In 2001, Doug Laney, then an analyst at consultancy Meta Group Inc., expanded the definition of big data. This expansion described the increase of the following:
- Volume of data being stored and used by organizations.
- Variety of data being generated by organizations.
- Velocity, or speed, in which that data was being created and updated.
Those three factors became known as the 3V's of big data. Gartner popularized this concept in 2005 after acquiring Meta Group and hiring Laney. Over time, the 3V's became the 5V's by adding value and veracity and sometimes a sixth V for variability.
Another significant development in the history of big data was the launch of the Hadoop distributed processing framework. Hadoop was launched in 2006 as an Apache open source project. This planted the seeds for a clustered platform built on top of commodity hardware that could run big data applications. The Hadoop framework of software tools is widely used for managing big data.
By 2011, big data analytics began to take a firm hold in organizations and the public eye, along with Hadoop and various related big data technologies.
Initially, as the Hadoop ecosystem took shape and started to mature, big data applications were primarily used by large internet and e-commerce companies such as Yahoo, Google and Facebook, as well as analytics and marketing services providers.
More recently, a broader variety of users have embraced big data analytics as a key technology driving digital transformation. Users include retailers, financial services firms, insurers, healthcare organizations, manufacturers, energy companies and other enterprises.
High-quality decision-making using data analysis can help contribute to a high-performance organization. Learn which roles and responsibilities are important to a data management team.