20 top BI tools and how to choose the right one
To help you buy the right BI tool for your data analysis needs, here's a look at 20 leading technologies, the different types of BI software and key features to look for.

Selecting the business intelligence tool that's the best fit for an organization's planned data analysis and reporting uses is critical to any BI project, at the enterprise level or in an individual business unit. The selection process involves gathering and prioritizing business requirements, documenting needed features and determining what style of BI software to buy, then evaluating the available products.
The ultimate goal is to ensure that the business intelligence tools you purchase are suited to the BI and analytics use cases being implemented. There are a lot of BI tools to choose from, and making the wrong decision puts the success -- and expected business benefits -- of BI applications at risk.
Establishing the scope of the BI project -- how many people will use the software and what data they'll need to access -- is the foundation of the selection process. The anticipated budgets for the initial deployment and future work to sustain and expand the BI system are also key factors. Too many business intelligence software evaluations start without any scoping or financial boundaries, resulting in time wasted examining BI and analytics tools that don't fit a company's needs or budget.
Evaluation criteria for BI tools
Before we outline some of the top products to consider, let's define the key features and functions you should look at to evaluate and select BI tools. They can be included as product criteria when it's time to create a request for proposal (RFP) to give to BI vendors.
This article is part of
Ultimate guide to business intelligence in the enterprise
Although product reviews by industry analysts and existing users can be a good source of introductory research, they're often oriented toward selecting the technology with the most features. Organizations should instead prioritize their requirements. To simplify that step, classify BI features and functions in these three groups:
- Must-haves. This classification should be unambiguous: If a product doesn't have a particular feature that's needed to meet your specific requirements, it should be eliminated from further consideration.
- Nice-to-haves. Although such features aren't required, they're often the differentiators when selecting a product.
- Will not use. Many BI tools have a laundry list of features that a company may never use. In that case, don't waste time examining those aspects of the products during the evaluation process.
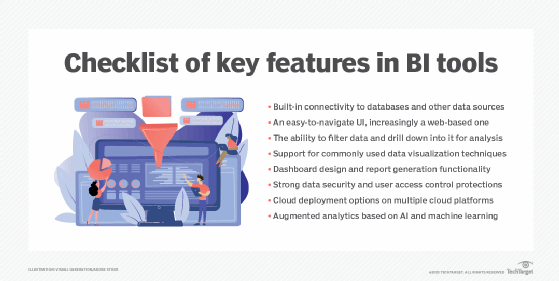
Overall BI features: The must-haves
The following items are often must-have BI features for organizations.
Data source connectivity. Access to various databases and file types, such as CSV, text, Excel and XML files, is a basic staple of BI tools. Increasingly, they provide access to specific applications, such as Salesforce. Specific needs will determine which connections are must-haves.
Web-based user interface. A web-based UI for data analysts and business users has become an industry best practice. It's more cost- and resource-effective for administration, support and deployment than a traditional client UI. In either format, the UI should be intuitive and easy to use.
Data filtering and drilldown capabilities. A tool should enable you to filter the contents of a BI dashboard or report by data values, using features such as drop-down menus, search filters and slicers. It should also enable the user to drill down from summarized information to more detailed data for further analysis.
Data visualizations. BI tools must provide bar, line, pie, area and radar chart types for data visualization uses, as well as the ability to mix and match various combinations of charts.
Dashboard and report design functions. In addition to visualizing data, the ability to design dashboards and create reports to share information with other users typically is a required element in BI software.
Security protections. Business intelligence tools require both individual user access controls and role-based security to designate who can create, modify, publish, use and administer BI applications. BI data security also involves using a combination of security mechanisms from the OS, network, databases and source system.
Support for cloud deployments. BI and business analytics systems are increasingly being deployed in the cloud, making cloud support -- including multi-cloud capabilities -- a common requirement in BI tools.
Augmented analytics technologies. Natural language querying capabilities and AI-driven features to aid users with data discovery, data preparation and other BI tasks are also becoming core components.
Must-have features specific to self-service BI
Several must-have features are specific to self-service BI use cases. They provide more data management functionality for business users who are creating and running analytics applications instead of relying on prebuilt applications and integrated data sets. These features include the following.
Selecting data for analysis. Self-service BI tools must enable users to select the data to be analyzed and present it in an interface like a pivot table, where dimension attributes are placed in rows and columns and filters are applied.
Data blending. The self-service software also must allow users to blend data from various source systems. This includes mapping or creating relationships between data from multiple sources.
Creating metrics. Users need to be able to create and save KPIs, other business metrics and calculations related to them for analytics uses.
Building data hierarchies. Another feature that users in self-service BI environments need is the ability to group and summarize data in dimensional hierarchies, such as by geography or product. This also establishes drilldown paths for deeper data analysis.
Saving queries and analyses. Self-service users should also be able to save queries, with data filters, metrics and drilldown paths included, so they can be reused.
Overall BI features: The nice-to-haves
The following features may not always be needed, but they're often the differentiators when selecting BI software.
Advanced visualizations. More advanced types of data visualizations include heatmaps, scatter plots, bubble charts, histograms, treemaps, network diagrams and geospatial mapping.
Collaboration and social interaction. BI tools can enable the creation of a community of users who share and discuss their data analysis work and collaborate on BI best practices.
Storyboarding. Data storytelling is a key facet of sharing the findings of BI applications with business executives. Storyboarding enables a series of data points and visualizations to be tied together with narrative text in a presentation that can be shared.
Microsoft Office data exchange. The ability to import and export data with Microsoft Office products, especially Excel, is often important to business users. Beyond simple import and export, BI tools can also provide real-time data integration with Office, enabling users to embed BI data into a spreadsheet or PowerPoint presentation and refresh it automatically as the data is updated.
Mobile BI support. Mobile BI capabilities can be useful to executives, sales teams and other workers. BI tools should be able to differentiate between viewing data in a web browser on a mobile device versus using a mobile BI app.
In-memory analytics. Pulling data into an in-memory cache or data store can enable very fast analytics performance.
Advanced analytics tools. Advanced analytics is usually done by data scientists, but some BI platforms now incorporate predictive analytics and data mining tools for what-if analysis of business scenarios. Such applications can involve both traditional structured data and sets of big data that may include a mix of structured, unstructured and semistructured data.
Low-code and no-code development. A growing number of BI vendors are incorporating low-code and no-code development tools into their platforms to streamline and simplify the process of building BI applications.
Leading BI tools
There are dozens of BI tools available in several product categories, including traditional query and reporting, self-service BI, online analytical processing (OLAP), curated data analysis and embedded analytics. Increasingly, those categories overlap with one another. For example, traditional BI tools have added self-service capabilities as that became the most popular form of business intelligence, and embedded BI software often incorporates self-service features into business applications.
But the different categories are useful for narrowing down your BI software options as part of the evaluation and selection process. To help with that, here's a list of 20 top BI tools, in alphabetical order and with capsule descriptions of their focus and features.
Alteryx. While the Alteryx platform is often used to prepare and model data for analysis with other BI tools, it also offers self-service BI software with a growing focus on automation and ease of use.
Domo. Domo's cloud-based software provides self-service BI capabilities for business executives and managers, with an emphasis on ease of use, dashboards and augmented intelligence features.
GoodData. First developed as a cloud BI platform and then focused on embedded analytics applications, GoodData now offers an expanded set of capabilities for self-service users in a data-as-a-service model.
IBM Cognos Analytics. Cognos, one of the most widely used traditional BI platforms, has been updated with user self-service, visual analysis, augmented analytics and other modern BI features.
Infor Birst. Birst, which was acquired by ERP software vendor Infor in 2017, is a cloud-based analysis and reporting platform that's now primarily geared to Infor's base of business applications users.
Logi Analytics. Bought by ERP vendor Insightsoftware in 2021, Logi is an embedded BI and analytics platform that offers a set of tools for software developers to build data analysis, predictive analytics and reporting capabilities into applications.
Looker. Acquired by Google in 2020, Looker is a cloud-based platform that data teams can use to develop data models and create curated data sets for BI and embedded analytics applications.
Microsoft Power BI. Power BI is a self-service BI platform that runs in the cloud and is updated with new features monthly. Microsoft also offers the less-functional Power BI Report Server for on-premises use.
MicroStrategy. Another traditional BI platform, MicroStrategy has been updated with self-service, data visualization and machine learning features and HyperIntelligence, a zero-click embedded analytics tool.
Oracle Analytics Cloud. This cloud service combines Oracle's various tools for self-service BI, reporting, visualization and augmented analytics. An Oracle Analytics Server on-premises version is also available.
Qlik Sense. It replaced the older QlikView software as Qlik's lead BI platform, with a more expansive set of self-service and guided analytics capabilities, plus new augmented intelligence and multi-cloud support.
SAP Analytics Cloud. SAP created a cloud-based platform with a range of BI and advanced analytics capabilities as a broader alternative to SAP BusinessObjects, the traditional BI suite it also still offers.
SAS Visual Analytics. This is the self-service BI, data visualization and reporting component of the cloud-based SAS Viya analytics platform, also now with location intelligence and augmented analytics tools.
Sisense. Sisense's cloud-native BI platform previously included curated analytics software for data teams and a tool for building self-service applications, but it's now focused on a Sisense Fusion embedded analytics offering.
Tableau. Initially focused on self-service BI for business units, Tableau has added augmented analytics capabilities and data management and modeling features for enterprise uses. It was bought by Salesforce in 2019.
Tableau CRM. Developed by Salesforce and previously called Einstein Analytics, the cloud-based software is now part of the Tableau product line. It supports AI-driven analytics and automated insights for users of Salesforce's CRM applications.
ThoughtSpot. This supports complex analysis of large data sets via a search-based UI with natural language querying and AI-driven analytics. Initially an on-premises platform, it now also runs in the cloud, which has become ThoughtSpot's primary focus.
Tibco Spotfire. One of the early self-service BI platforms, Spotfire has been updated with AI, search and data wrangling features. Tibco also offers Jaspersoft, an embedded analytics and reporting tool, and now the next entry.
WebFocus. Originally developed by Information Builders, a venerable BI vendor that Tibco acquired in early 2021, this is traditional BI software that has been updated with cloud support and AI tools, plus other features.
Yellowfin. This platform includes a suite of tools for data discovery, data preparation, dashboard design, automated alerts and data storytelling, with a focus on embedded analytics and mobile BI applications.
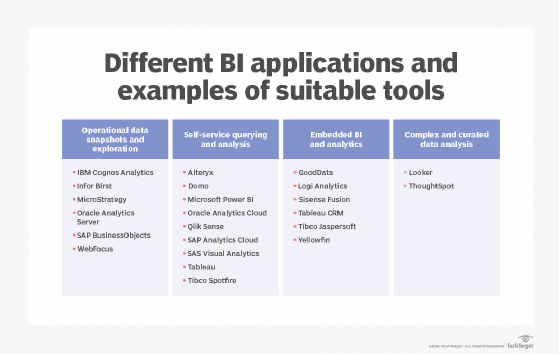
Selecting the right BI category and style
The following use case descriptions can help you select the appropriate category and style of BI software. Many enterprises have multiple use cases, which makes it even more important to match the right types of BI tools to the right business users.
Operational snapshots. The business needs a recurring snapshot of operational performance on a daily, weekly, monthly or quarterly basis. The performance metrics and data that need to be reviewed are well-defined, and the analysis work typically involves period-over-period comparisons and trends.
Business users may filter data based on agreed-upon criteria, but they primarily want to do some analysis quickly and then get back to their jobs. To make that feasible, they need tabular reports with easy-to-grasp graphics.
Recommended BI category and style: Guided analysis/reporting tools.
Limited data exploration. Similar to the first use case, the business needs a consistent set of data and performance metrics on a recurring basis, but in this scenario, the users want to do limited data exploration themselves. They still primarily require a mix of tabular data and basic business graphics, but they also need to be able to drill down into the information for further analysis.
That combination can best be accomplished through BI dashboards that are a mashup of several related graphics with underlying detailed data that business users can access, filter and analyze. Dashboards have traditionally been created by IT or BI team members, but they're increasingly now being built by business analysts and other users themselves.
Recommended BI category and style: Guided analysis/dashboards.
Analysis of data sets that aren't predetermined. In this use case, the analytics questions aren't predefined and most data analysis is done just once. The users typically are business analysts who are self-sufficient in finding and analyzing data. In fact, they may have created "data shadow systems" -- spreadsheets informally used to gather and analyze data -- for themselves or business colleagues, and they're often the subject matter experts who IT and BI managers turn to on source systems.
Self-service BI tools with ad hoc query capabilities were built for business analysts and other data-savvy end users who need to do intensive data exploration to determine what data is relevant to their needs and then create queries to do the required analysis.
Recommended BI category and style: Self-service BI/ad hoc analysis.
Data analysis with metrics that aren't defined in advance. In this case, there's a known collection of data sets, but the performance metrics may be defined while the data analysis is being done. As above, the analysis work is often one-time in nature and typically requires data-savvy business analysts.
However, in some cases, the analysts doing this type of analysis aren't proficient in using query-based BI tools -- they're more comfortable with Excel. The best match for them is OLAP or pivot table analysis tools that function just like working in a spreadsheet.
Recommended BI category and style: Self-service BI/OLAP or pivot table analysis.
Analysis of unknown data sets and metrics. This is another self-service BI example in which business analysts and other users need to both blend data and define performance metrics during the analysis process. In doing so, they may need to engage in extensive data exploration work.
That can point toward an easy-to-use but feature-rich BI product, such as data discovery and analysis tools. They include query functions, data visualization capabilities and built-in dashboard design features that can be used to deliver analytics results to business managers on either a one-time or recurring basis.
Recommended BI category and style: Self-service BI/data discovery.