Coronavirus quickly expands role of analytics in enterprises
While NLP and embedded BI were expected to be key analytics trends, the effect of the pandemic on enterprises' takeup of analytics instead was the biggest development of 2020.
Analytics, like just about everything else in 2020, was significantly affected by the coronavirus.
As 2019 wound down, the expectations were that natural language processing and embedded business intelligence would be among the biggest trends in analytics in 2020.
But at that point no one knew COVID-19, much less a pandemic, was coming. And once the pandemic started to spread in the United States in March and states issued stay-at-home decrees to try to stop the spread of the virus, organizations needed data to quickly make decisions about how to survive a sudden and dramatic loss of business.
Many of those that hadn't yet turned to analytics suddenly adopted a data-driven approach to identify efficiencies and even attempt to find alternative revenue streams, and many others who were already using analytics to some degree accelerated the pace at which they committed to data-driven decision-making.
That, in turn, led to the acceleration of digital transformation, the larger phenomenon of organizations moving to digitize most phases of their operations.
"How do you react when the world gets turned upside down?" said Dave Menninger, research director of data and analytics research at Ventana Research. "Using analytics, organizations can understand their options better and track their progress as they chart a new direction. Without it, they would be flying blind. So COVID-19 served to highlight the importance of BI and analytics."
A molecular-level photo of the coronavirus.
Similarly, Dan Sommer, senior director and global market intelligence lead at Qlik, said COVID-19 has shown just how critical analytics can be to organizations, especially in bad times.
When things are going well, organizations can be more free with their spending and not base every decision on data. But when revenue streams evaporate and the coffers run dry, data is the means by which organizations can maximize efficiency and perhaps even pivot their business to survive as the pandemic persists.
How do you react when the world gets turned upside down? Using analytics, organizations can understand their options better and track their progress as they chart a new direction. Without it, they would be flying blind.
Dave MenningerResearch director of data and analytics research, Ventana Research
And that data needs to be as current as possible.
"Since the pandemic arrived, we've seen a surge in the need for real-time and up-to-date data," Sommer said. "What is usually fairly stale -- quarterly business forecasts, for example -- is fleeting and mutable now. Alerts, data refreshes and forecasts will need to occur more often, with the freshest variables."
That need for up-to-date data was demonstrated early in the pandemic when supply chains were disrupted.
Hospitals scrambled to secure personal protective equipment, and in some parts of the U.S. where there were a high number of COVID-19 cases, needed donations from areas that hadn't yet been hit hard. Meanwhile, toilet paper was suddenly in short supply when people starting hoarding it in anticipation of a shortage.
Now, with the coronavirus surging again, supply chains may be disrupted once again and organizations will continue to need data in near real time.
"Surges like these are accentuated in a crisis, and we have to build preparedness for them," Sommer said. "The infrastructure and applications are available, enabling a gradual transition to active intelligence. That will be a big factor in helping enterprises pre-act."
Digital transformation
The preparedness Sommer referred to, of course, comes from analytics.
The need for that readiness, meanwhile, led to more digital transformation. Organizations are recognizing the need for agility during the pandemic, and that agility is fed by data. In some cases, that's meant using SaaS platforms, which can be deployed quickly and are designed with ease of use in mind. In others that's involved making decisions based on public health data and people analytics tools.
"Even if an organization wasn't using analytics previously, they were exposed to all sorts of public analytics of the pandemic," Menninger said. "Multiple companies made return-to-work analytics available, so even if organizations didn't have their own analytics tools, they now have access to these tools."
While organizations in survival mode turned to analytics, BI vendors too tried to do their part in the fight against the spread of the virus.
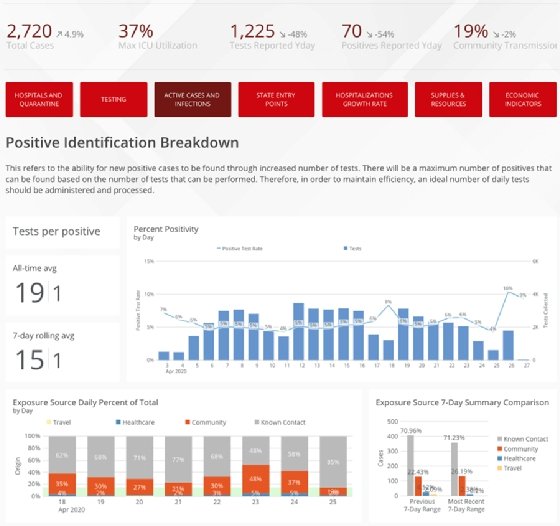
Many came up with dashboards to show the spread of the virus, and some designed capabilities specifically for organizations engaged in the fight against the spread of the disease like health care organizations and government agencies.
A sample dashboard from analytics vendor Domo displays coronavirusinfection data.
Meanwhile, COVID-19 data from organizations like the Centers for Disease Control and Prevention and Johns Hopkins University was widely disseminated on news broadcasts and featured prominently in newspapers, helping put analytics in the public consciousness.
Combine that with 2020 being a general election year with polling data an important predictor of who would be the next U.S. president, and analytics seeped into people's everyday lives like never before, according to Andrew Beers, Tableau's chief technology officer.
"Data dominated the public consciousness in 2020, from poll trackers attempting to predict the U.S. presidential election to heat maps tracking the spread of the COVID-19 pandemic, making 2020 the year of the citizen data analyst," he said. "Tools like the Tableau COVID Data Hub [and those from other vendors] led to a deeper understanding of the spread of the virus, and how the country can work together to get back to normal."
Natural language processing
Despite the dominant effect the coronavirus had on analytics in 2020, other trends also accelerated over the course of the year.
Vendors continued to add NLP capabilities to their platforms to enable wider use by business employees without a background in data science.
Tableau, for example, introduced Explain Data, a tool that provides natural language explanations about data points, in 2019 and updated it in early 2020.
"The introduction of AI features to analytics platforms, such as natural language processing, helps to bridge the gap between data skills and data jobs, lowering the barrier to entry for these in-demand positions," Beers said, noting that LinkedIn listed data scientist as its third-ranked in-demand job for 2020.
Qlik, meanwhile, unveiled Insight Advisor Chat, a feature that uses NLP and natural language generation capabilities to generate both narrative and visual responses to user queries, in September. And Microsoft added data storytelling capabilities to Power BI that same month.
"We see many vendors offering an 'explain' or 'insights' feature that applies machine learning techniques to automatically analyze the data and present an explanation of what was identified," Menninger said.
He added, however, that the NLP tools are currently better at offering narratives about data than they are at handling queries in natural language.
Given the inherent complexities of language and the fact that natural language query tools don't actually understand the spoken or written word -- they convert spoken or written words to SQL and then back from SQL to human language -- they're struggling to be truly conversational.
"Vendors are still struggling to interpret completely free-form text and convert them to queries, just like I am still struggling to get my smart home speaker to launch the correct playlist for me," Menninger said.
Automation on the rise
Along the lines of NLP, which is aimed at simplifying query and analysis and easing the burdens on data scientists, the goal of business process automation and embedded BI is increased organizational efficiency.
And with data scientists in short supply -- and in part due to COVID-19 as well -- enterprises need more organizational efficiency.
As a result, Alteryx, a vendor specializing in data management whose platform was once geared toward data scientists but now aims to enable business users, was among those that prioritized robotic process automation in 2020.
Other vendors, meanwhile, enhanced the embedded BI capabilities of their platforms as a means of enabling increased efficiency. Among them, MicroStrategy continued to update HyperIntelligence, its embedded analytics tool, while Yellowfin and Sisense upgraded their tools for embedded application development.
"Business process management has been around for decades, [but] what's new is that we can now not only model it but also mine, automate and optimize a process via technologies like robotic process automation, process mining, alerting and embedded analytics," Sommer said. "As leaders look to reengineer the way things get done, the efficiency metric will only grow in importance and priority."
Cloud migration
Another 2020 trend was continued migration to the cloud.
As users accumulate more data, they need more power from their analytics platforms in order to store and quickly access and analyze their data. That power comes from the cloud.
As a result, newer vendors such as Sigma Computing and Looker are cloud-only. Other vendors, meanwhile, are enhancing their cloud capabilities. Qlik, for example, offered a separate SaaS version of its enterprise platform, GoodData completely overhauled its platform to enable self-service users, and IBI -- formerly Information Builders -- made the cloud a primary focus.
"Most vendors have made substantial progress on cloud-based delivery of their capabilities, including several major vendors that are now cloud-first," Menninger said.
There was even some merger and acquisition activity late in 2020 when Tibco acquired IBI, but that lone major acquisition was nothing like the spring of 2019 when Google acquired Looker and Salesforce bought Tableau within days of each other, and Qlik made major purchases to aid its data management capabilities.
But while there were advancements in NLP, automation and migration to the cloud -- and two longtime BI vendors combined forces -- the effect of the coronavirus pandemic on enterprises' adoption of analytics was clearly the most significant development of 2020.
And with 2021 looming and the pandemic threatening to force a second round of stay-at-home orders, it's likely that more organizations will recognize the value of data analysis and the accelerated upward trajectory of enterprise analytics will continue into next year.