Feeding America, Tableau use data to fight hunger together
The nonprofit has partnered with the Tableau Foundation since 2015, and it is enabling its network of food banks to make data-driven decisions with the analytics vendor's tools.
Data is helping fuel Feeding America in its fight to end hunger.
The nonprofit, founded in 1979 and based in Chicago, is the largest hunger-relief organization in the United States, supporting food banks, food pantries and meal programs with funding and advocacy. Each year, it reaches about 40 million people in need of food.
According to Feeding America, about one in nine people in the United States face hunger.
In its effort to combat hunger, the organization maintains a network of more than 200 Feeding America food banks, which are individually operated charitable organizations that distribute food. Many of those food banks subsequently distribute food directly through about 60,000 food pantries and meal programs.
Data from those food banks is key, helping Feeding America understand the scope of hunger in the U.S. and informing a host of decisions ranging from how much food to order to fundraising efforts.
Six years ago, however, data from those food banks was disparate, distributed, inconsistent and often weeks or even months old by the time it was delivered to the national office.
Feeding America turned to Tableau, the Seattle-based analytics vendor, for help.
In 2015, the organization formed a partnership with the Tableau Foundation, and in the six subsequent years has received $4.11 million in funding to enable Feeding America to turn its data into an asset in the fight against hunger. In addition, the organization works with Slalom, a consulting firm based in Seattle, to develop an IT roadmap aimed at modernizing its technology.
"[Tableau] allows us to provide better support to food banks," Stephanie Zidek, director of data and analytics at Feeding America, said during Tableau Conference 2021, the vendor's virtual user conference.
"It also allows us -- as a whole network -- to advance our analytics to provide more in-depth and more flexible analysis to the different kinds of questions people across the network might be asking about the work we're doing," she continued.
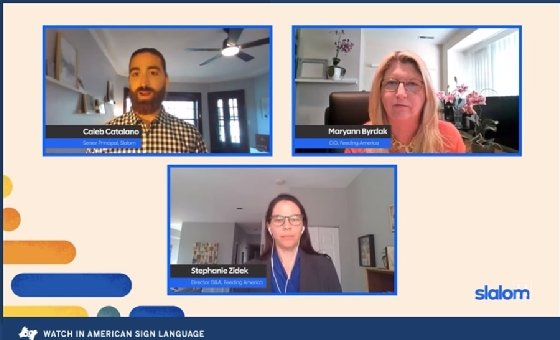
Caleb Catalano (top left), a senior principal at consulting firm Slalom, moderates a session during Tableau Conference 2021 featuring Feeding America CIO Maryann Byrdak (top right) and director of data and analytics Stephanie Zidek.
Evolution with data
Six years ago, Feeding America was unable to provide in-depth and flexible analysis.
No standard data practices were in place among the 200 Feeding America food banks. Each food bank's data was housed on premises rather than in a central location. And since each food bank is individually operated, the data housed in each was handled differently.
When the central office collected data from the food banks, it did it manually. And while some updates were done quarterly, others were done just once per year, according to Zidek.
Key to becoming more efficient in the fight against hunger was to collect all that data as it was gathered rather than months later and centralize all that data, providing Feeding America with more real-time information and leading to better insights.
[Tableau] allows us to provide better support to food banks. It also allows us -- as a whole network -- to advance our analytics to provide more in-depth and more flexible analysis to the different kinds of questions people across the network might be asking about the work we're doing.
Stephanie ZidekDirector of data and analytics, Feeding America
Real-time data would enable the organization to understand such information as where need is greatest and where there are supply surpluses and deficits. The faster such information is available, the faster Feeding America can get food resources where they're needed.
Feeding America's first step was to create a data warehouse. Next, it developed a pipeline to collect ERP data from each food bank daily. Finally, it installed Tableau on top of the data warehouse to enable both the central office and each of the individual food banks to be able to see the data and make data-driven decisions.
"That enables our food banks to have reports and insights on a daily basis without having to hire analysts or analytics resources," said Maryann Byrdak, Feeding America's chief information officer. "It provides things in a standardized way from a centralized system and relies on the expertise we have at the national office to help them do their work and not spend time normalizing data and reporting on it."
Feeding America's work with Tableau is a long-term engagement, she continued.
"We're not done," Byrdak said. "We're just starting on this journey, but it's [already] been very impactful."
It took time to convince some that using Tableau dashboards would enable them to better battle hunger in their local population. It also took time to provide Tableau licenses and training, and build out its member data sharing program.
At first, the information provided by dashboards was rear-facing and based on what was essentially survey data collected only once per year. Now, transaction-level data -- for example, pounds of food being received and distributed -- is being collected automatically and shared on a daily basis.
"Now, food banks can have this data readily at their fingertips, and have it be consistent," Zidek said. "With this set of dashboards readily available to food banks and to all of the users at their food bank, everyone is going to the same place and to get their information and they get a consistent response when asking questions."
Now, there are management views of dashboards and distribution views so the data that people at food banks view is tailored to their role, and Feeding America is working to get food banks to connect with one another so they can benchmark their operations.
Meanwhile, Feeding America's work has been critical throughout the pandemic.
Unemployment skyrocketed in the spring of 2020 as local economies were shut down in an attempt to control the spread of COVID-19. With that rise in unemployment, food uncertainty also increased.
Five years into it partnership with Tableau, Feeding America was able to react.
"Data has become ever more important in our pandemic response," Zidek said. "We realize the need for more frequent, more regular readily accessible data to be able to respond in real time to what's going on to provide support."
Roadmap
As Feeding America moves forward with its use of data and analytics, it's working with Slalom to develop a roadmap that enables it to expand its analytics capabilities.
One key is continuing to build out its data warehouse. Another is working with partners such as the Tableau Foundation to drive analytics adoption and provide thought leadership.
"It's about our mission as an organization and centering on that person in need and how we can provide support to them," Zidek said. "We think data can inform a lot of decisions and strategy. By bringing pieces of data together from across our network, we have the opportunity to continue to support our neighbors in need."