Graph analytics being used in childhood cancer research
With relational databases limited in how they connect data points, graph database tools from TigerGraph are aiding the Technical University of Denmark's childhood cancer research.
Graph analytics is aiding the Technical University of Denmark in its fight against childhood cancer.
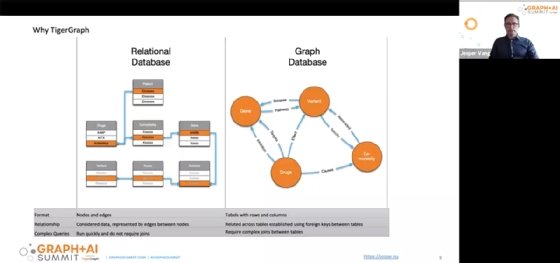
Graph analytics takes advantage of graph databases, which differ from traditional relational databases in the way data points interact with one another in-database. In a relational database, data points can only connect with one other data point at any given time. In graph databases, however, data points can connect with multiple data points simultaneously.
Among the benefits of graph databases are the ability to speed the time it takes to develop data sets that can drive insights and to reveal complex relationships between data points, such as between a person and their network of acquaintances or one cell and a network of other cells.
Technical University of Denmark (DTU), meanwhile, is currently attempting to improve the diagnosis, treatment and cure rates of acute lymphoblastic leukemia in children.
At the core of its study is data.
The university is collecting data from a host of different sources about germline DNA and tumor RNA with the goal of finding links between germlines and somatic variants -- an alteration in DNA that occurs after conception and is not present within the germline -- and children with acute lymphoblastic leukemia.
"Our long-term goal is to create one of the most respected, multidisciplinary research groups within childhood cancer," said Jesper Vang, a Ph.D. student in the Department of Health Technology at DTU, on April 21 in a presentation during Graph + AI Summit, an open conference hosted by graph analytics vendor TigerGraph.
"To achieve that we of course need great partners, researchers and also a great data infrastructure," he continued.
Jesper Vang, a Ph.D. student in the Department of Health Technology at the Technical University of Denmark (DTU), discusses DTU's use of graph analytics to enable its research into the cause of childhood cancer.
In order to handle the massive amount of data being collected and organize it to make it usable, DTU needed a system that could manage its data pipeline, and turned to Sentieon, a vendor specializing in technology for the medical industry.
For in-database analysis, however, DTU needed a tool that could run complex queries and discover intricate relationships between data points without being prompted, and do so quickly.
To accomplish its goals, DTU decided to use a graph database for its analytics rather than a relational database, and selected TigerGraph's graph analytics tools to power its effort to battle childhood acute lymphoblastic leukemia.
"The integration and modeling of all our knowledge is the key to our project and the progress we're making toward understanding more about why children get cancer, why some relapse and why some are less tolerant to treatments," Vang said.
The integration and modeling of all our knowledge is the key to our project and the progress we're making toward understanding more about why children get cancer, why some relapse and why some are less tolerant to treatments.
Jesper VangPh.D. student, Department of Health Technology, DTU
Graph analytics has been key to that integration and modeling, he continued.
Relational databases aren't able to understand the complex relationships between all the data points in DTU's childhood cancer research. They understand direct relationships well, but much of DTU's research includes indirect relationships.
Graph databases, however, are able to connect indirect data points and quickly respond to queries that a database manager may not expect and may not have prepared data sets to answer.
"Graph databases make it possible to answer random questions," Vang said. "Those are pretty typical in a hospital where a doctor might come up with a question and expect that it can be answered because the answer must be somewhere in the data. Using graph, we can answer more of these questions as long as the data exists and there's a path between it."
Vang added that relational databases can be efficient for small amounts of complex medical data, but they become more inefficient as the amount of data and number of relationships grow, while graph databases remain efficient.
"Graph databases such as TigerGraph are extendable to add new sources so we don't have to redefine the database every time we add new sources of information," he said.
With research still ongoing, the results of DTU's study to improve the diagnosis and treatment of childhood acute lymphoblastic leukemia aren't yet available. Vang, however, said he hopes to showcase the results when TigerGraph hosts the next Graph + AI Summit scheduled for September.