Tableau dashboard tips and tricks from an expert author
In this excerpt from his new book on using Tableau CRM, data expert Mark Tossell takes readers step by step through best practices for dashboard creation.

Tableau CRM is a powerful, versatile data analytics platform that can extract, combine, transform and visualize data to create valuable business insights. But people with expert proficiency in Tableau CRM are hard to find. In Creating Actionable Insights Using Tableau CRM, data expert Mark Tossell takes readers step by step through the implementation process for Tableau.
Check out this edited excerpt on best practices for Tableau dashboard design to get a taste of how this new book can help you gain Tableau CRM (TCRM) competency so you can start quickly to solve pressing business problems.
In the context of building dashboards in TCRM, what constitutes best practice?
When possible, build with the GUI.
One mistake I see quite regularly is where people with developer backgrounds -- those who are confident building using code -- build almost everything in TCRM using JSON and SAQL. The result is a clumsy, bulky build that is difficult for others to come in and edit. It is not robust or scalable.
As a general rule, it is best to work within the limits of the GUI, using clicks not code, until you hit a ceiling where you then supplement your build with SAQL and JSON as required.
Be judicious in your use of SAQL.
This point follows on naturally from the previous one -- limit your use of SAQL to where it is absolutely required. Keep in mind several thoughts on this subject:
- Excessive SAQL queries in a dashboard will hinder performance.
- Lengthy, complex and convoluted SAQL queries can be very difficult to troubleshoot, edit or expand.
- To minimize your use of SAQL, it can be helpful in some cases to go back to the data set and do your legwork there instead.
Know when to go back to the data set.
It can be helpful to go back to the data set level to minimize the use of code; that is, aggregation and transformation can often best be performed in the data set, as opposed to building code into the dashboard design itself. Examples of this approach include the following:
- Aggregating data
- Bucketing data
- Applying complex data transformations
- Joining data sets
Leverage dashboard components where practical.
Dashboard components can be a clever way to reduce effort and ensure consistency across your dashboard designs.
Follow along in your dev org as I walk you through an example of how to use components:
- Open My First Dashboard.
- Go into Edit mode.
- Copy the dashboard by clicking on Clone in New Tab.
- Save as a Dashboard components dashboard.
- Create a new page and name it Playground.
- Drag a component widget onto the new page.
- Click on Component inside the widget.
- Click on Create new component.
- A new Analytics Studio tab will be created; this is where you will design the new component, ready to save and add to your dashboards.
- Configure the component page to match your dashboard, with 50 columns, fine row height and zero cell spacing.
- From the Dashboard components dashboard, copy the highlights panel container and all of its widgets.
- Change the widget backgrounds to transparent.
- Save the component as Highlights panel in the Shared App.
You can now go back to your Dashboard components dashboard and add the Highlights panel component, as the component will now appear in your list when you click on the blank component. The Dashboard components dashboard will now look as follows, with the component details shown on the right-hand side:
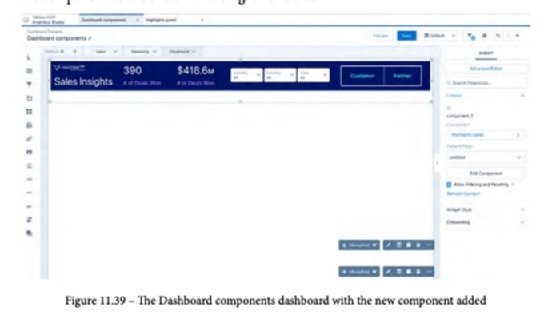
Dashboard components are a very powerful and versatile tool; they can even have multiple pages added so that a dashboard can have pages within pages!
Effective dashboards are essential. According to Gartner, only 20% of analytics dashboards created in 2022 will deliver tangible business outcomes. This means most dashboards will fail.
The secret sauce of Tableau CRM, compared to other data analytics tools or platforms, is its ability to easily embed your dashboards in Salesforce and get action insights directly from a chart or table. Click here to learn more about this guide to Tableau dashboard design.