
everythingpossible - Fotolia
Yellowfin Signals delivers automated insights to BI users
BI vendor Yellowfin's Signals tool automatically alerts users about changes in business data with an aim to broaden the use of analytics in organizations.

All too often with BI software, you can sense a vendor's organizational structure surfacing through the user experience. The recognition is rarely a happy one -- data engine developers and visualization teams often have quite different disciplines. Tools for business analysts may include all the latest BI bling, while the tools for IT administrators in the same products remain spare and functional.
For sure, many BI vendors run a UI consistency review as part of the release process. In such cases, removing irregularities feels like fixing a bug. These symptomatic approaches rarely address the underlying problem, which is not inconsistent implementation, but uneven attention to design. Yellowfin, though, aims to resolve that issue with Yellowfin Signals and the other tools in its namesake BI suite.
As articulated by Glen Rabie, Yellowfin's founder and CEO, the Melbourne, Australia-based company's principles apply to both its products and the teams that build them. "I believe that most value is created by the people at the edges of the organization," he told me. "As a result, we want to drive decision-making and action to the edge of the business."
Rabie's innovations as a leader include self-managed teams and a radical ban on leadership meetings in favor of engaging people across the company in more one-to-one conversations. Thanks to that approach, the Yellowfin organization is showing up in the products in a positive way. The Yellowfin BI technology is also frequently several steps ahead of larger rivals in areas like automated insights and user collaboration.
Signaling virtue on data analysis
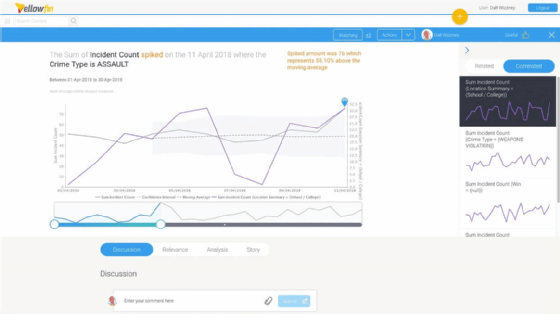
Version 8 of the Yellowfin software, released in late 2018, changed it from an all-in-one platform to a suite of five products. Yellowfin Signals is a particularly interesting addition to the suite; it constantly runs algorithms that look for sudden rises and falls, outliers, and other changes -- i.e., signals -- in data.
The Signals tool uses automation and machine learning to reduce what Rabie calls analysis fatigue. "The work required to conduct comprehensive comparative analysis is almost impossible to do manually," he said. "Yet data analysts were spending an inordinate amount of time trying every possible combination to find that nugget of gold."
The ability to glean these insights is a critical element of the analytics user experience. Before we can think through and act on data, something in it that we can prioritize needs to catch our attention. Yet many BI vendors fail to think much about this need. Their developers appear to value pushing out ever more information, in as eye-catching a manner as possible. When all your visualizations demand equal attention, without a way to see what's important in data at a glance, analysis can feel fatiguing indeed.
Yellowfin takes a more considerate path. For example, in the 8.0.1 release of Yellowfin Signals that became available in March 2019, the text that explains a signal uses formatting and color to cue users on whether the data changes are positive or negative for the business. The signal understands that a decline in, say, the cost of sales is, in fact, a good sign and highlights the data accordingly.
The user, having glimpsed a signal and seeing that it requires action, can share the insight with others, assign tasks as needed and generally govern the process of responding to what the algorithms have uncovered.
Adam Sandler and your weekly sales report
Good software design is often simple -- but not easy and always thoughtful. In one of the most telling updates in Yellowfin Signals 8.0.1, Yellowfin simplified the embedded rating system, which enables users to personalize the tool so they see specific insights they find useful and aren't bothered by ones they don't. A thumbs-up and thumbs-down model has now replaced the initial star ratings.
We've seen something similar before: Netflix stars for thumbs in 2017. To Todd Yellin, vice president of product at Netflix, thumb ratings are "the language of the global internet," while using stars "feels very yesterday," as he said in a press conference when the change was announced.
The issue for Yellin was simple enough, but it was subtle in its implications. Netflix viewers used stars to score the quality of films and shows and to project a self-image of their tastes, but that may not have reflected what they really watched. In an example Yellin cited, a foreign documentary may get five stars after a single viewing, but that three-star Adam Sandler comedy is your favorite for every pizza night with friends. So it's not just ratings that influence Netflix's viewing recommendations -- it analyzes usage, too.
Yellowfin Signals functions in a similar way. It recognizes actions you take as you work with the software and uses that knowledge to help personalize your feed. What makes a top-rated report -- one with impressive visualizations and fascinating insights? Thumbs up -- yes, you do want to see more of those. Yet every week, you open the plain sales dashboard even if you never really admire it enough to give it a thumbs up.
It will be interesting to see if Yellowfin gets the same kind of results that Netflix did from its ratings change. The number of ratings by Netflix users increased 200% during extensive testing of the thumb-based approach in 2016, according to Yellin. Simpler engagement led to more engagement.
A glimpse of what's to come in analytics
At first sight, these small improvements in Yellowfin Signals 8.0.1 may seem inconsequential. Yet they reveal an important characteristic of the company behind them: a thoughtful approach to the user in BI software design and an organization that consistently puts the unglamorous daily work of users above more obvious advantages.
As automation becomes ever-more important to the work of data analysis, we need to see more decisions and actions at the edge of the business and better collaboration flowing through business operations. Cue signals.