Tableau BI gets Extensions API in version 2018.2 update
Tableau's BI software sees general release of a 2018.2 update with an API for dashboard extensions, while a 2018.3 beta adds more new analytics capabilities.
Amid positive early reviews, Tableau has launched Tableau 2018.2, an extensive upgrade that amplifies the scope of Tableau BI tools with expanded analytics functions and a more streamlined dashboard.
The update comes a few days after Tableau released the beta version of 2018.3 that further simplifies the user interface and enables users to more easily consolidate different sources of data.
The general release version of 2018.2 brings a range of notable changes and new capabilities to Tableau BI tools that introduces customized third-party capabilities to the self-service analytics and data visualization platform.
Released in beta form in April, this week's formal release of Tableau 2018.2 enables nonbeta users to use several new features, including automatic mobile layouts and Spatial Join, which integrates disparate data sources under a single common attribute.
Probably the two most significant features the release adds to Tableau BI tools are in Dashboard Extensions and Tableau Services Manager.
Drag-and-drop dashboard extensions
The Extensions API essentially opens the platform to both first-party and third-party developers and users, allowing them to create and share their own dashboard extensions with different functionalities.
It's really exciting to see what the community is able to do and also the creativity of folks to take self-service analytics to the next level.
Francois Ajenstatchief product officer, Tableau
"It's really exciting to see what the community is able to do and also the creativity of folks to take self-service analytics to the next level," said Francois Ajenstat, chief product officer at Tableau.
Introducing third-party extensions to a dashboard is a drag-and-drop process, and the new Extensions Gallery enables users to browse and select extensions made by Tableau partners. For example, the feature could let users who, on their own, might not be able to design, say, a predictive analytics model, to simply drag and drop one in.
The Extensions API and several other recent dashboard design enhancements will be welcomed by Tableau users, said Jen Underwood, founder and principal analyst at Tampa, Fla.-based Impact Analytix LLC.
It could "open up a new world of possibilities for augmented analytics, machine learning, statistics, advanced analytics, workflow and other types of apps to integrate directly within Tableau," Underwood said.
The other standout feature of the new release of 2018.2 is Tableau Services Manager, which allows Tableau Server administration to be done completely through the browser, and generally tries to make server management simpler and faster.
New update enters beta
The beta release of Tableau 2018.3 brings its own expanded capabilities to Tableau BI tools, including dashboard navigation buttons in Tableau Desktop, transparent worksheet backgrounds and a mixed content display in Tableau Server and Online that can show all of a user's content on the same page.
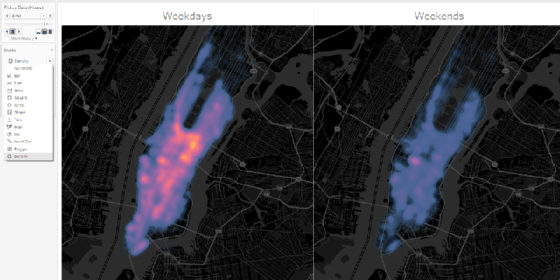
Heatmaps, a new mark or chart type for Tableau, are expected to be added to the beta in a future update, Tableau said in a blog post.
Manhattan taxicab data shown in heatmap format expected in beta release.
While Tableau did not say when 2018.3 would be officially released, in sticking to the company's quarterly schedule, it can likely be expected to leave beta this fall. Betas can see numerous tweaks and adjustments before the official release and even "fundamental changes," depending on customer feedback or Tableau's own observations," Ajenstat said.
Seeking to simplify
The new Tableau BI capabilities introduced in the updates are indicative of Tableau's business mission, "to help people see and understand data," Ajenstat said.
Future updates, he said, will likely be aimed at making "analytics easier for everyone," and will incorporate smart capabilities with tools like AI, machine learning and natural language processing, in part due to the organization's recent acquisition of MIT AI startup Empirical Systems.
Tableau's announcements came as competitor Qlik, which research and advisory firm Gartner regularly ranks highly alongside Tableau and Microsoft's Power BI, announced the acquisition of self-service BI and data visualization startup Podium Data. According to Qlik, the move will increase the company's ability to compete with Tableau.