Using visualizations and analytics in media content
By using the best mass media BI practices, from data visualization to measuring metrics, companies like Condé Nast and Comcast are attracting consumers and raising revenues.
BOSTON -- Among countless online newspapers and journals, blogs, videos and social media feeds, the modern digital consumer has a dizzying amount of media sources to choose from.
As content creators vie for consumer attention, some organizations have turned to data visualization and advanced analytics in media to gain an advantage.
Visualizing data analytics in media
Take, for example, Condé Nast, an American-based mass media company whose 19 brands attract around 150 million consumers.
With a diverse portfolio that includes The New Yorker, Wired and Teen Vogue, the media company needs to capture the attention of numerous social groups and niches around the world. Condé Nast has found that interactive charts and graphs seem to appeal to inquisitiveness of most types of consumers.
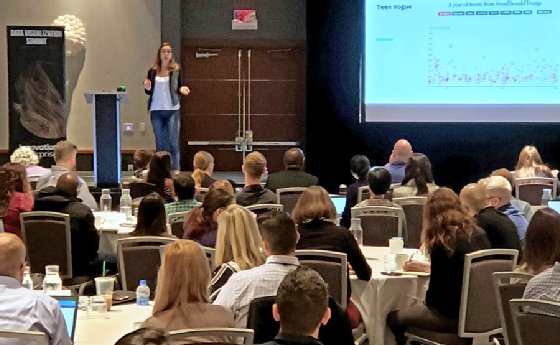
Compared with static images, interactive visualizations "introduce a whole new level [to content], and increase time spent" on content by consumers, said Danielle Carrick, a data visualization designer and developer at Condé Nast, during a presentation this week at the 2018 Data Visualization Summit.
Carrick showed examples of colorful, easy-to-read charts and graphs. Large gray and red bars with moveable sliders on the entertainment and culture site Glamourplainly illustrated the disparity between men and women Oscar nominees since 1928.
On Teen Vogue, an in-depth interactive scatterplot of tweets from @realDonaldTrump splashed red dots across the screen. Each visualization, though in itself an example of analytics in media, was different.
"Same type of data, totally different way to look at it," Carrick said of the visualizations.
Danielle Carrick of Condé Nast speaks at the 2018 Data Visualization Summit in Boston this week.
Static still around
The benefits of consistently changing the way data sets are illustrated are twofold, Carrick said. This varied approach gives consumers new and fresh ways to interact with different data sets, and also enables her and her team to be creative.
Same type of data, totally different way to look at it.
Danielle Carrickdata visualization designer and developer, Condé Nast
Carrick noted that despite the increased use of interactive visuals, static graphs and images are far from being phased out.
Static visuals still are used most often, and are developed separately by each brand, rather than a team working directly under the Condé Nast flag. Understandably, interactive data sets are harder to create, and require input from the local editor, writer and design team working on the content piece.
There's a lot of communication, Carrick said, and ultimately, it's up to the brand to decide if it will use the visual.
"They're not going to publish something they don't think they're readers are interested in," she said.
And while Carrick admitted that more tracking needs to be done to measure the results of using interactive visuals, they seem to both draw in more consumers and keep them on the webpage longer.
In a separate presentation at the parallel 2018 Big Data Innovation Summit, Carla Pacione, senior director of data and systems at Comcast Spotlight, talked about how advanced analytics plays a role in the telecommunication conglomerate's advertising efforts. In particular, Pacione highlighted the importance of digital metrics, which she claimed to have "really took the level of advertising to a whole new level."
Thanks to new and updated technologies in TV and digital metrics, including embedding a pixel in commercials that can capture household and engagement data, organizations like Comcast can better measure metrics today and enable them to gain deeper insights, Pacione said.
Comcast is piloting more advanced "household addressable TV advertising" -- the ability to send more targeted and relevant ads to different households watching the same TV program.
While Pacione noted Comcast uses third-party organizations to track purchases and predict future purchases, better being able to measure metrics has enabled such analytics in media advertising advancements.
With so many different ways of consuming media, Pacione said it will be important for media partners to work together to share information and advice and ultimately better target consumers.
Already, she said, "we're starting to see that sharing in the industry because there's just so much to learn."
The 2018 Data Visualization Summit and the 2018 Big Data Innovation Summit were held Sept. 11 to 12 at the Renaissance Boston Waterfront Hotel.