Tableau 2019.3 highlighted by enhanced AI, new data catalog
Tableau released its third-quarter update Wednesday, featuring Explain Data, an enhanced augmented intelligence tool, and Tableau Catalog, a data management suite.
Tableau 2019.3, featuring enhanced augmented intelligence capabilities and a new data catalog tool, hit the market Wednesday.
Tableau updates its main business intelligence platform on a quarterly basis, and Tableau 2019.3 is the vendor's third-quarter release. It's also the first since Tableau's $15.7 billion acquisition by Salesforce was completed at the beginning of August.
Perhaps the flagship tool of the new release is Explain Data, an AI product that's built directly into Tableau. The tool uses statistical algorithms to analyze data and subsequently explain what drives specific data points.
In addition, Tableau introduced Tableau Catalog, a new feature that's part of the vendor's Data Management suite and helps customers first view their data and then ultimately use the correct data.
Finally, Tableau rolled out the Tableau Server Management Add-on, a new offering designed to help clients manage the deployment of Tableau Server across their enterprise. The server management product is a collection of five tools, including two for users who deploy their server on AWS and one for content migration, to help organizations in their attempt to effectively govern their data.
"Explain Data is a bit of a catch-up announcement since many other BI vendors have already introduced AI for BI capabilities, such as ThoughtSpot, Yellowfin and Power BI," said Wayne Eckerson, president of Eckerson Group. "It seems less expansive than some other tools since users must select data points to trigger the analysis, instead of a chart or data set. The data point becomes the dependent variable and it then analyzes a data set to see what correlates with it -- so a good first step."
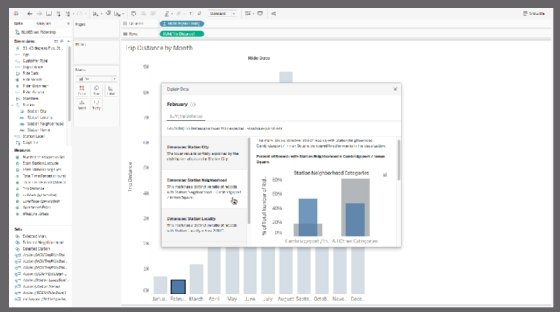
An Explain Data dashboard shows a user's bicycle ridership by month with February highlighted with additional data.
Boris Evelson, principal analyst at Forrester Research, said that Explain Data will help Tableau's self-service users make more efficient use of their data and subsequently become better data scientists.
"This capability can turn a power BI user into a citizen data scientist," he said. "In other words, this capability allows one to perform deeper analysis."
This capability can turn a power BI user into a citizen data scientist. In other words, this capability allows one to perform deeper analysis.
Boris EvelsonPrincipal analyst, Forrester Research
Regarding Tableau Catalog, Eckerson said it's a product he's been expecting to see from Tableau. Given the needs of the vendor's many self-service customers, a tool to help them organize their data and find the clean data they need in order to make good decisions was needed.
"This makes it easier for people to find data imported into Tableau and discover where it's being used, so a metadata management tool for lineage and impact analysis," he said.
The new products included in Tableau 2019.3 were developed as a result of the combination of feedback from existing Tableau users and the company's own attempt to remain an innovative vendor of BI products.
"On Explain Data, part of it is about making sure that more and more analysts can get to the right answers to their questions," Beers said.
Tableau Catalog, meanwhile, as Eckerson theorized, was developed in response to the explosion of self-service users, according to Beers.
"This is us seeing the next steps in the evolution of self-service in the enterprise," he said. "Self-service has been wildly successful, and has gotten a lot more people using data … and the next step of that is you have to give some control and visibility over that so that community of people and content remains healthy."