While examining key performance metrics is vital to helping organizations make data-driven decisions, geospatial data can be a valuable way to get an even greater understanding of enterprise operations.
During a presentation during Oracle's ongoing virtual Analytics Summit, Mark Daynes, innovation director of IT consulting firm and Oracle partner Beyond Systems, demonstrated just how geospatial data can be used to understand not only what is happening but also where it is happening.
"Oracle databases have got and have had for a long time spatial capabilities, but you might need to be a programmer to get the best out of that," Daynes said. "However, Spatial Studio provides a relatively easy-to-use [graphical user interface] so you can drag and drop and just click commands in order to do spatial analysis."
Use case
Using a fictitious restaurant looking to market a new delivery service as an example, Daynes went through the entire process of deriving insights from geospatial data, from loading data into Oracle Spatial Studio all the way through visualization and action in Oracle Analytics.
Meanwhile, though Daynes limited his presentation to his fictitious restaurant and didn't delve into real-world examples of how actual organizations can use geospatial data to make data-driven decisions, one area in which such data has been critical in recent months is in battling the spread of COVID-19.
Healthcare providers are using geospatial data to prepare for potential patient surges, and state governments are using it to inform decisions about how and when to reopen their economies. In places like Massachusetts, where stay-at-home measures seem to have stemmed the spread of the virus, the data is enabling the state to set up testing facilities in targeted communities. In New York, another state where stay-at-home measures appear to have stemmed the spread of the virus, state officials have used the data to inform decisions about which visitors need to quarantine for two weeks.
Spatial Studio provides a relatively easy-to-use [graphical user interface] so you can drag and drop and just click commands in order to do spatial analysis.
Mark DaynesInnovation director, Beyond Systems
The fictitious restaurant Daynes created is located in London and has data on its customers such as where they live and how much they've spent dining at the restaurant. The restaurant decided to offer delivery to anyone living in a 3-mile radius of the restaurant's location. The establishment will, therefore, target its marketing at all customers living within that radius. Beyond that, however, the business will make extra efforts to attract the customers who already spend the most with the restaurant.
And it's partially by examining geospatial data -- mapping -- that the restaurant will be able to tell who to target.
"We're going to do some spatial analysis to find some insights using the spatial capabilities of the Oracle Spatial Studio tool," Daynes said. "Then we're going to take the data we've analyzed and bring it into Oracle Analytics, and we're going to do some analysis on that to find some extra value on that and see how these products work together."
Without ever writing code, Daynes took two tables stored in Oracle Analytics -- a list of customers with their addresses and the amount they've spent at the restaurant and then simply the location of the restaurant -- loaded them into Spatial Studio and named them. The tool then automatically geocoded the addresses, and by dragging and dropping the geocoded data set from one side of the user interface to the other, Daynes created a map with dots showing where each of the restaurant's customers lives.
Next, he added layers to the map.
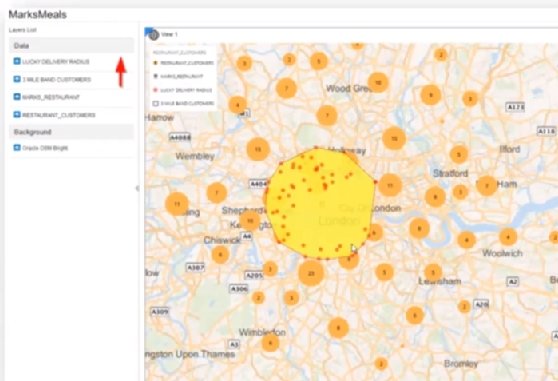
He added the location of the restaurant, and then chose from a menu of potential filters to show customers within a 3-mile radius and put a circle around that radius. With just a click he was then able to view clusters of customers, and with another click he was able to create a heat map.
"These are all just instant ways of visualizing that data that wasn't available to me before," Daynes said.
A fictitious restaurant's geospatial customer data is displayed on a map.
Extracting the geospatial data
Once he finished creating his maps, Daynes exported the restaurant's geocoded data into Oracle Analytics where he could dive more deeply into analysis, such as joining the location data with transaction data to start identifying customers to target for delivery.
The data can be sorted to display customers' spending -- including names -- from high to low on a bar chart, for example, or on a map adjacent to a bar chart on the same dashboard. And by hovering over an individual customer's name, all of their information can be viewed.
Once deliveries begin, users can also join that data.
"Spatial Studio is excellent for creating and manipulating subsets of data that would be more challenging to do otherwise, and then it can be passed off to Oracle Analytics to consume the results of that spatial analysis and augment it with other data," Daynes said. "It really helps create stories."