Startup Sisu adds more automation to its analytics platform
Sisu recently introduced Smart Waterfall Charts, a tool that automates the development of certain visualizations, as part of its effort to find ways to explain changes in data.
As Sisu approaches two years since it emerged from stealth, the analytics vendor continues to focus on simplifying the process of discovering why changes happen, while adding capabilities that enable organizations to understand what to do next.
When Sisu, founded in 2018 and based in San Francisco, went public with its capabilities in November 2019, it had one simple, straightforward focus. Its analytics platform used machine learning and statistical analysis to automatically monitor changes in data sets. But rather than just alert customers to changes in those data sets, it also aimed to explain why those changes occurred.
Soon, in July 2020, the vendor expanded the different ways it could explain changes to key metrics, adding capabilities such as the ability to diagnose the results of A/B and other group comparison testing.
And then in early 2021, Sisu redesigned its entire analytics platform to include a central repository where organizations can define their key performance indicators so those metrics have the same designation across all departments.
Since then, the most significant addition to the Sisu analytics platform has been the release of Smart Waterfall Charts, according to Peter Bailis, founder and CEO of Sisu.
Smart Waterfalls
The new feature, which Sisu unveiled in the spring, aims to deliver the right information to users when they need it.
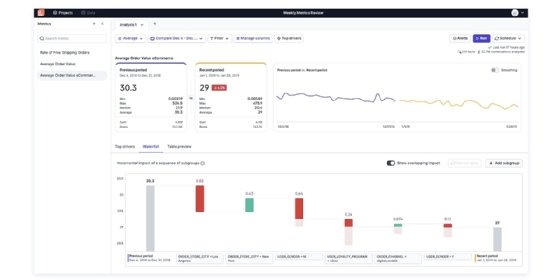
Frequently, when key metrics change, data analysts need to develop summaries of what took place and deliver those to the organization's leaders. And often, they'll use a waterfall chart -- a visualization that shows the effect of sequentially introduced data -- to do so.
An organization's shipping data is displayed in a sample Smart Waterfall Chart from Sisu.
Building those charts, however, is a manual process, and it's time-consuming.
Just as the Sisu analytics platform is designed to automate explanations, Smart Waterfall Charts automates the creation of waterfall charts. It uses machine learning to quickly examine all potential factors that led to a change, select the most meaningful ones, put them in the waterfall chart and share the chart with key decision-makers.
"This saves analysts days of time because we're, essentially, selecting the factors that appear on the waterfall, [and then we] collectively explain the change and put it in a business-friendly format," Bailis said, noting that manually combing through the factors that could potentially explain a change is onerous.
Smart Waterfall Charts, meanwhile, is interactive, Bailis added.
"We'll give them the first cut, and if they want to pull in a new factor that wasn't in the waterfall, they can do that and we'll reorganize the chart," he said. "It's a very iterative process. Otherwise, they're just guessing what to put in."
They're automatically figuring out what's changed and what are the key drivers and doing some pretty sophisticated analysis to come up with the waterfall representation.
David MenningerSenior vice president and research director, Ventana Research
That removal of guesswork is key, according to David Menninger, senior vice president and research director at Ventana Research.
"They're automatically figuring out what's changed and what are the key drivers and doing some pretty sophisticated analysis to come up with the waterfall representation," he said. "It's useful from the perspective that it would be complicated for many people to do that type of analysis. They automate sophisticated analyses."
He cautioned, however, that analysts still need to exercise critical thinking and shouldn't become over-reliant on automation tools such as Smart Waterfall Charts.
"Analysts still need to apply the 'does this make sense' filter," he said.
Future plans
While Sisu is already attracting new users -- Bailis said the vendor's customer base quadrupled over the past fiscal year -- it has grand plans for the future.
Fifteen or so years ago, people had different devices for different purposes -- a mobile calendar, a cellphone, an email application and a web browser were all separate. Now, they're all in one in mobile devices.
Today, as organizations attempt to harness data and make data-driven decisions, they have business intelligence platforms, spreadsheets, notebooks, PDFs and more, and they're all separate.
Sisu hopes to bring about 80% of all those elements that go into data-driven decision-making into one analytics environment over the next 12 months and, eventually, all of it into one analytics environment.
"This a real pull from our users," Bailis said. "If they can bring all the elements together in one platform to see what's going on and why they're going on and reduce the friction to get the results and deliver actionable results, it would be huge."
The challenge, he continued, is to satisfy the needs of different end users.
"It's a tough problem to go and solve because we want to keep the analyst and the decision-maker in the same platform," Bailis said.
Long term, meanwhile, Sisu wants to continue adding automation capabilities to its platform to both give more potential users access to analytics and also streamline the workflows of data analysts, according to Bailis.
"The opportunity we see is augmenting the human and going beyond business intelligence," he said. "It's a big goal to have everyone be able to access data and answer all these questions. What they're missing is that link, in terms of the right level of automation to go beyond what's happening to the why."
And, ultimately, reaching that level of automation could take 10 years, Bailis added.
In the interim, to ensure Sisu can last those 10 years, Menninger said he'd like to see Sisu expand its partner program to include a group of traditional BI vendors.
One of Sisu's challenges is showing how it's different from traditional BI vendors, but by partnering with those BI vendors to add traditional capabilities, it would highlight how Sisu is unique.
"The challenge for Sisu is that they're doing something different than other vendors, but they need to find a way to get people's attention," Menninger said. "By partnering, it becomes more obvious what your differences are. It shows why you would use both things together, because, in the near term, Sisu is not likely to become a complete analytics platform -- building that is a monumental task."