10 BI dashboard design principles and best practices
BI dashboards are a key tool for delivering analytics data to business users. Here's how to design effective dashboards that can help drive informed decision-making.

Business intelligence dashboards display KPIs and other data for business executives, managers and workers in a visual interface. Good BI dashboard design starts by thinking about UX, as well as the data needs of users and the overall goals of the business. It's not just about presenting numbers, but also figuring out what to draw attention to and how to do so effectively.
"Analytics is only powerful if it drives action," said Penny Wand, a director in the technology practice at IT and business consultancy West Monroe Partners. BI dashboards that deliver useful information to help guide decision-making "are growing in popularity because of a business need to increase the value of data assets combined with the fact that most people are visual learners," Wand said.
She added that well-designed dashboards with informative data visualizations can also increase curiosity about data among business users and spread data literacy more broadly in organizations -- for example, by providing operational feedback and guidance to frontline workers.
Here are 10 principles, best practices and design tips for building effective dashboards that provide views of revenue, product sales, orders, profits and other business metrics, using both historical and real-time data to support different BI applications.
This article is part of
Ultimate guide to business intelligence in the enterprise
1. Test dashboard designs early and often
Good BI dashboard design requires exploring which way of representing data makes the most sense to users. Just because something looks nice or makes sense to a skilled BI analyst doesn't mean it will work for the people in the business trenches. Wand said she sees BI professionals in many companies spend too much time focusing on the perfect design before getting around to testing it with the intended users.
A good practice, she advised, is to use the dashboard creation process to inform the final design. That involves working with end users in a cycle of visual data exploration and design iteration to see what keeps them motivated to use a dashboard.
2. Provide context and direction to dashboard users
Many dashboards don't provide enough context or direction to users. As a result, it isn't clear to people that the information being presented is relevant to their jobs, and they may view a dashboard as noise instead of a useful tool.
"Dashboards are both a sore spot for users and the most important feature you can provide," said Travis Rehl, vice president of product at CloudCheckr, a cloud management platform vendor. BI teams need to craft dashboards for specific user types, Rehl said. Doing so "greatly increases the usefulness of the dashboard and makes it the landing page of choice for individuals," he noted.
It's also beneficial to think about how to help users start their search for data or get information on specific business issues, rather than try to make a dashboard the be-all and end-all of their BI and data analysis needs, according to Rehl.
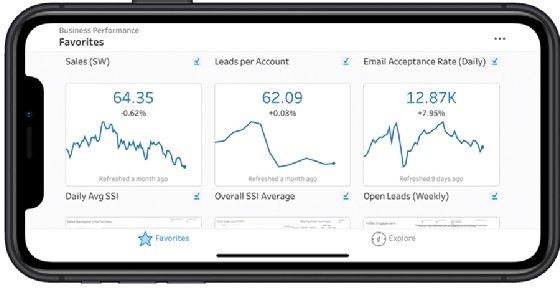
For example, good dashboard design should consider what users will want to look into at the start of the workday, he said. The first questions people have can be as simple as, "How are we doing today?" or, "Did anything important happen yesterday?" A dashboard should make it easy for them to get that information. "Regardless of the data you're trying to convey, you need to have [entry points] that invite the user to explore your data and find their answers," Rehl said.
3. Remove the data cruft from dashboards
Don't overdo the data you include in a dashboard. Providing too many KPIs and other metrics complicates the analysis process and often leads to dashboard fatigue for users, Rehl warned. "If your target audience is an executive who cares about a particular KPI, only show the relevant data specific to that KPI."
Rehl works with his team at CloudCheckr to exercise restraint in adding content to the dashboards that are built into its platform. There are hundreds of ways they could show relevant, but not necessarily important, data to users, he said. "The key is to understand how our customers need to use this data and design to anticipate their needs."
Soumya Bijjal, director of product management at open source data infrastructure platform provider Aiven, made a similar point. "By designing dashboards to understand each user and present only the necessary information, companies will get a lot more out of their data," she said.
4. Think through the user experience
BI dashboard designers sometimes treat all data as equal, Bijjal said. But differences in presentation and analysis capabilities can have a huge impact on how the data in a dashboard is manipulated and used, she added.
For example, in many cases, a user will begin by searching for a specific answer. A valuable dashboard should bring the user to that answer but also offer views of larger trends and provide drill-down data analysis features, Bijjal said.
"Great dashboards are also individualized and customizable, allowing different teams to craft different [versions] for their own purposes," she said. That helps address a common challenge: Dashboards often have multiple audiences. It's hard to provide value to all of them in a one-size-fits-all design.
5. Choose the right data visualization types
Dashboard designers can choose from a plethora of data visualization options, from line charts, bar charts and pie charts to more complex graphs and visuals. But they need to consider how different charts and other visualization techniques will affect the experiences of dashboard users.
"It's important to understand what type of information you want to convey and choose a data visualization that is suited to the task," said Manjula Mahajan, director of data and analytics at storage vendor NetApp. She recommended designers ask the following questions to help narrow down the right chart type or alternative visualization for a data set:
- How well does the visualization relay the intended information?
- How much distraction is there in the visualization? Extraneous data may cause confusion.
- Does it appeal to people's visual perception for making sense of information?
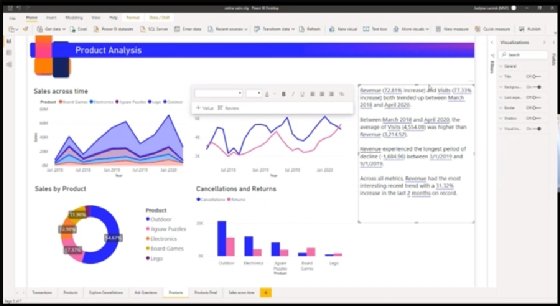
Often, the most effective approach is to use multiple visualizations to present the data in a dashboard. "There's a time and a place for most visualization techniques, and the best way to address a given use case is usually a variety of different visualization techniques in one view," said Joshua Moore, principal technologist for cloud analytics at NetApp.
6. Focus on layout, colors, labels and other design elements
Basic dashboard design elements can have an outsized impact on the way users view BI dashboards -- and interpret the data they contain. For example, the use of colors can sometimes make the difference between good and bad dashboard design. "Wrong color use can really break a visualization, and it's probably the first thing people notice," said Patrik Lundblad, a visualization advocate and lead product designer at BI software vendor Qlik.
Keeping visualizations and dashboards color-neutral is often considered boring by users. But adding too much color in the wrong way might confuse people and even make them jump to the wrong conclusions about data, especially in cases where poor color choices are combined with other bad design practices, such as an inverted Y-axis in a chart.
Other items that can affect the success of dashboard designs include titles, labels and explanatory text, as well as the use of white space and the overall layout of a dashboard's components.
Ramesh Hariharan, CTO at consulting firm LatentView Analytics, suggested using simple designs that do an effective job of getting ideas across, instead of adding a lot of fancy graphics that aren't really necessary. "The emphasis has moved away from excessive ornamentation and toward helping humans perceive information better," he said.
7. Tie BI dashboards into business processes
Dashboards, generally, are thought of as informational in nature. Now, though, enterprises can also use them as an analytics interface in operational systems and processes.
"Businesses are transcending traditional BI by infusing what we call data experiences into day-to-day tools and workflows, using the abundance of available data for closing the gap between discovering insights and taking action," said Pedro Arellano, head of product marketing at Google's Looker data platform unit.
_mobile.png)
For example, marketing departments are using curated data sets and dashboards to automatically adjust their bids on online ad placements based on how the ads are performing, Arellano said. Designing BI dashboards for such uses requires thinking about how to simplify the way the data is organized and presented to different users involved in the supported business process, he advised.
8. Establish a dashboard development lifecycle
Good BI dashboard design is an iterative process that can be refined and improved to get the best results, Wand said. She suggested that companies consider creating a methodology akin to the software development lifecycle for designing dashboards, with the following steps:
- Identify user requirements and tap cross-functional expertise to determine the potential value of a dashboard and the availability of required data.
- Within a few days, evaluate data quality and work collaboratively to create a dashboard design and validate its analytical and visual effectiveness.
- Use initial feedback from users to determine whether the dashboard adds the expected value or could be modified to do so. If not, drop it, and rethink the plan.
- Work with the various participants on a high-level analysis of factors that may have affected the ability to create the dashboard, provide the right data or use it effectively. Identify gaps and ways to minimize the issues.
- Take the insights from the review back to the first step and repeat the cycle, while also communicating them to a broader group of BI team members and business stakeholders.
9. Use the dashboard design process to standardize data
Different departments, and even individuals within a department, sometimes have different ways of thinking about, and defining, the same data. That has implications not only for how the data is used to drive business decisions, but also what's required to ensure good data governance as part of the BI process that feeds information to dashboards.
Wand recommended BI teams look to uncover differences in data definitions and business metrics when they design dashboards. That can spark conversations to foster a better cross-functional understanding of data relationships and data quality and consistency issues, she said. It can also help initiate or improve data governance efforts aimed at creating internal data standards and policies.
10. Train end users on how to use dashboards
Don't assume BI dashboards will be self-explanatory to business users and training isn't required on how to use them. A successful dashboard design project "requires a commitment to addressing the human aspects of technology deployment," Wand said.
You should start, she said, by identifying power users who can spot problems and help others get the most out of new or updated dashboards. It's also important to develop a training and communication plan and ensure there's a feedback mechanism for users. In addition, Wand suggested launching a pilot program with a small group of users before scaling up a dashboard deployment.